引入
1
| <script src="http://code.highcharts.com/highcharts.js"></script>
|
HTML代码
1
| <div id="container"></div>
|
JavaScript代码
1
2
3
4
5
6
7
8
9
10
11
12
13
14
15
16
17
18
19
20
21
22
23
24
25
26
27
28
29
30
31
32
33
34
35
36
37
38
39
40
41
42
| $(document).ready(function () {
var chart = new Highcharts.Chart({
chart: {
renderTo: "container",
type: 'column',
events: {
load: function (event) {
$.post("/blog/highlight", function (result) {
var rows = result.rows;
var xArr = new Array();
var yArr = new Array();
for (var i = 0; i < rows.length; i++) {
xArr.push(rows[i].name);
yArr.push(rows[i].num);
}
chart.xAxis[0].categories = xArr;
chart.series[0].setData(yArr);
}, "json");
}
}
},
title: {
text: '剩余水果数量'
},
xAxis: {
title: '水果类型',
},
yAxis: {
title: {
text: '数量'
}
},
series: [{
name: '数量',
}]
});
});
|
Java代码
Fruit实体类
1
2
3
4
5
6
7
8
9
10
11
12
13
14
15
16
17
18
19
20
21
22
23
24
25
26
27
28
29
30
31
32
33
34
35
36
37
38
39
40
41
42
43
44
45
46
47
48
49
50
51
52
53
54
55
56
| package com.ledao.entity;
public class Fruit {
private Integer id;
private String name;
private Integer num;
public Fruit() {
}
public Fruit(String name, Integer num) {
this.name = name;
this.num = num;
}
public Integer getId() {
return id;
}
public void setId(Integer id) {
this.id = id;
}
public String getName() {
return name;
}
public void setName(String name) {
this.name = name;
}
public Integer getNum() {
return num;
}
public void setNum(Integer num) {
this.num = num;
}
}
|
从后台获取数据
1
2
3
4
5
6
7
8
9
10
11
12
13
14
| @ResponseBody
@RequestMapping("/highlight")
public Map highlight() {
Map resultMap = new HashMap<>(16);
List<Fruit> fruitList = new ArrayList<>();
fruitList.add(new Fruit("苹果",8));
fruitList.add(new Fruit("香蕉",2));
fruitList.add(new Fruit("梨",16));
fruitList.add(new Fruit("油桃",7));
fruitList.add(new Fruit("西瓜",13));
fruitList.add(new Fruit("橘子",5));
resultMap.put("rows", fruitList);
return resultMap;
}
|
结果截图
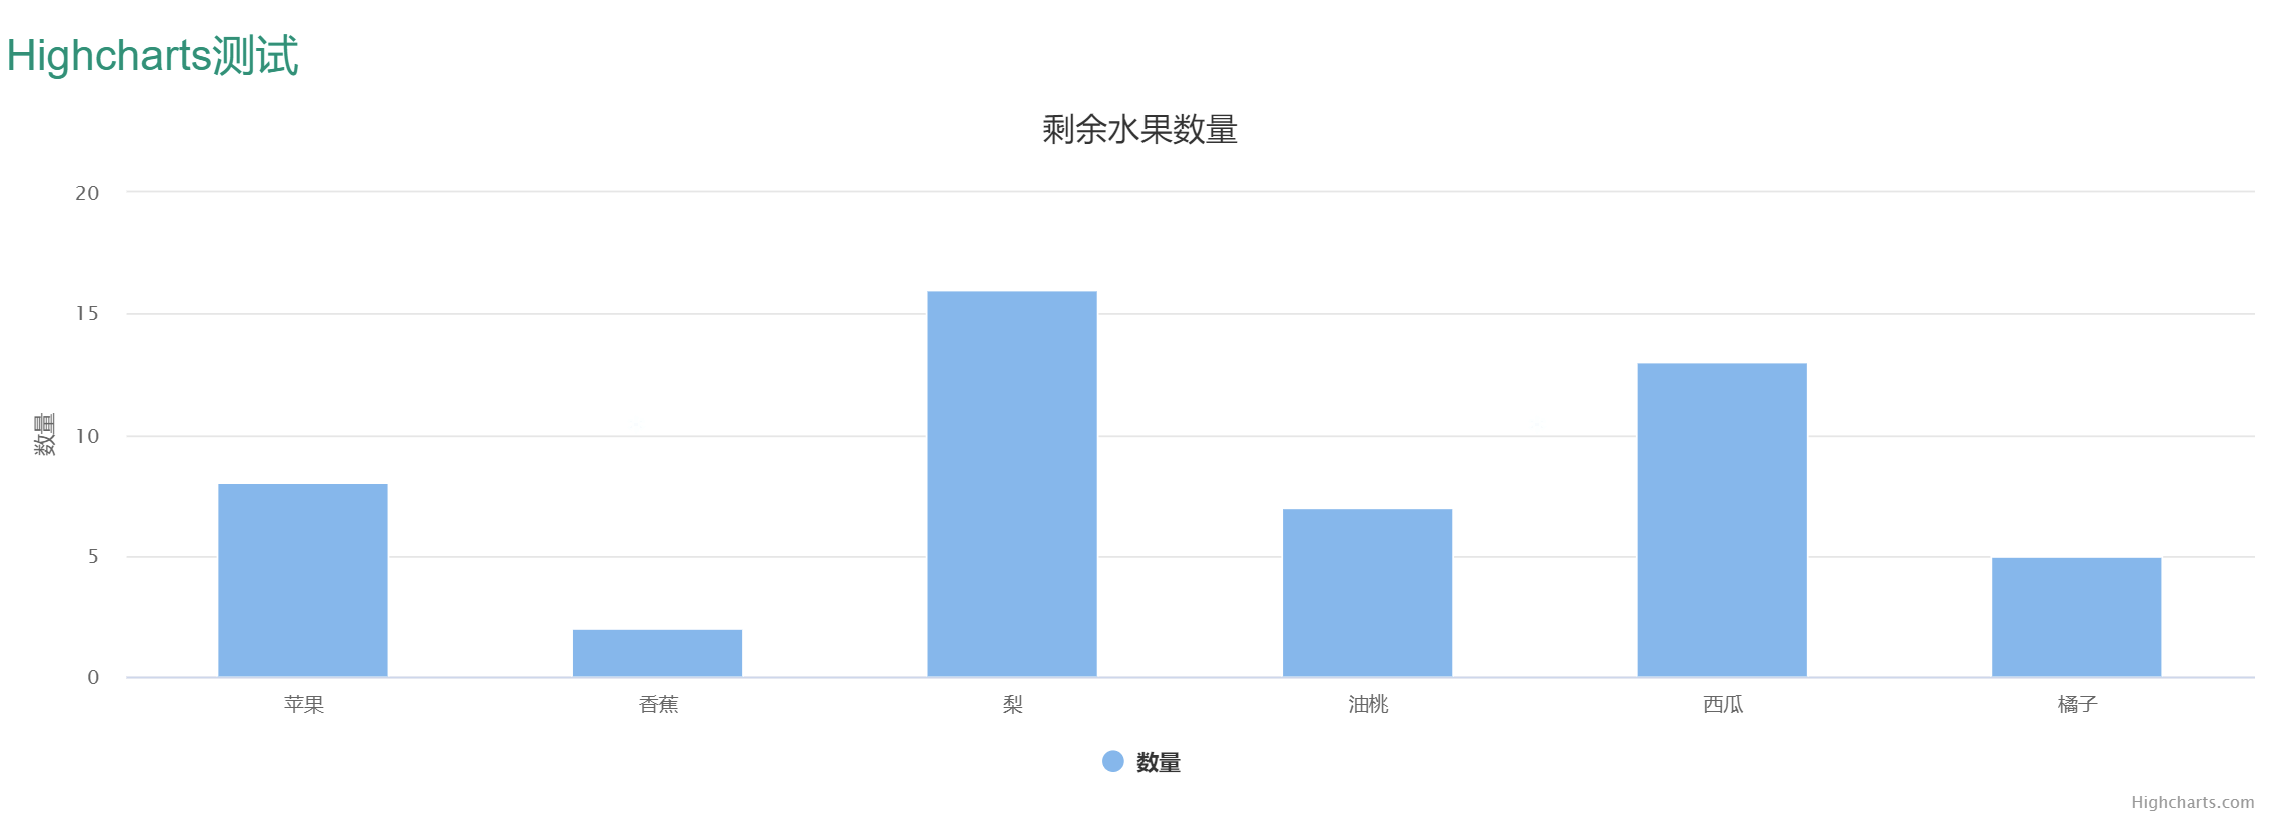
PS.
如果将上面的柱状图换成折线图,将JavaScript代码中的 type: ‘column’ 改为 type: ‘line’ 即可
使用了jQuery,请先引入jQuery
Highcharts中文官网:兼容 IE6+、完美支持移动端、图表类型丰富的 HTML5 交互图表 | Highcharts


