1
2
3
4
5
6
7
8
9
10
11
12
13
14
15
16
17
18
19
20
21
22
23
24
25
26
27
28
29
30
31
32
33
34
35
36
37
38
39
40
41
42
43
44
45
46
47
48
49
50
51
52
53
54
55
56
57
58
59
60
61
62
63
64
65
66
67
68
69
70
71
72
73
74
75
76
77
78
79
| <script setup>
import { ref, onMounted } from "vue";
import * as echarts from "echarts"
let echart = echarts;
const initChart = () => {
let chart1 = echart.init(document.getElementById("myEcharts1"), "light")
chart1.setOption({
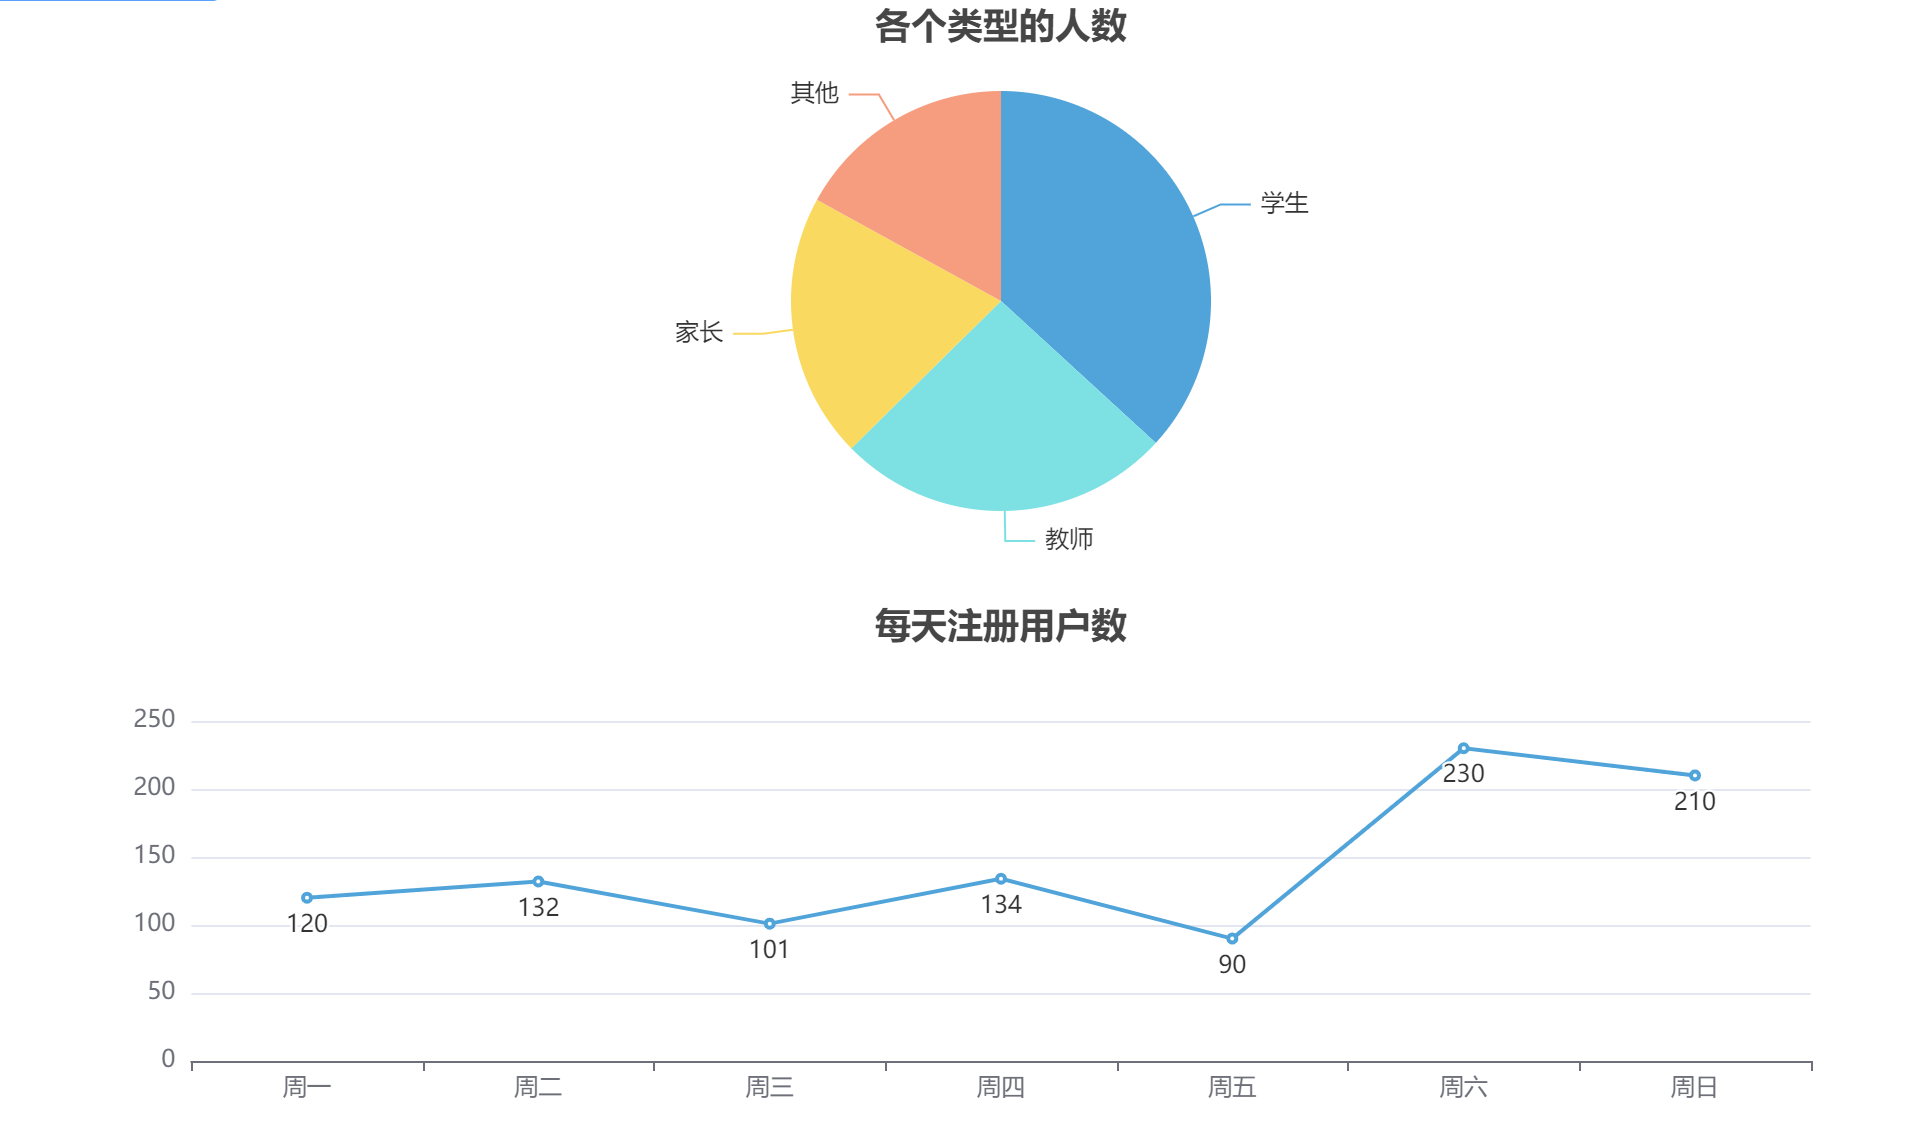
title: {
text: '各个类型的人数',
left: 'center'
},
tooltip: {
trigger: 'item'
},
legend: {
orient: 'vertical',
bottom: 'bottom',
show: false
},
series: [
{
name: '被复制的总次数',
type: 'pie',
radius: '70%',
data: [
{ value: 1048, name: '学生' },
{ value: 735, name: '教师' },
{ value: 580, name: '家长' },
{ value: 484, name: '其他' }
],
emphasis: {
itemStyle: {
shadowBlur: 10,
shadowOffsetX: 0,
shadowColor: 'rgba(0, 0, 0, 0.5)'
}
},
}
]
})
let chart2 = echart.init(document.getElementById("myEcharts2"), "light")
chart2.setOption({
xAxis: {
type: 'category',
data: ['周一', '周二', '周三', '周四', '周五', '周六', '周日']
},
yAxis: {
type: 'value'
},
series: [
{
data: [120, 132, 101, 134, 90, 230, 210],
type: 'line',
label: {
show: true,
position: 'bottom'
}
}
],
tooltip: {
trigger: 'item'
},
title: {
text: '每天注册用户数',
left: 'center'
}
})
}
onMounted(() => {
initChart()
})
</script>
|